Quantify your lateral flow assays with Quantifyr
Quantifyr enables you to quickly and accurately measure the intensity of all well-known lateral flow assays. This eliminates the need for a physical lateral flow reader or manual evaluation using tools like ImageJ.
To achieve this, we use a neural network powered by next-generation computer vision to identify one or more lateral flow assays within an image.
By performing an industry-standard contrast analysis on the grayscale image, we can precisely measure the test's intensity.
Please be aware that this is not a certified service and that we cannot provide any liability for the results of the analyses. However, we are working on certification in order to be able to guarantee the reliability of the results. Until then, please treat the results with caution.
Instructions
Analyzing a lateral flow assay is straightforward. Simply place the assay on a neutral surface, take a photo, and align it so the control line (C) is at the top and the test line (T) is at the bottom. Ensure the assay is centered and straight in the image to achieve the best results.
Next, upload the image to Quantifyr, and you'll receive the result within seconds.
This is a good example how you should position the lateral flow assay: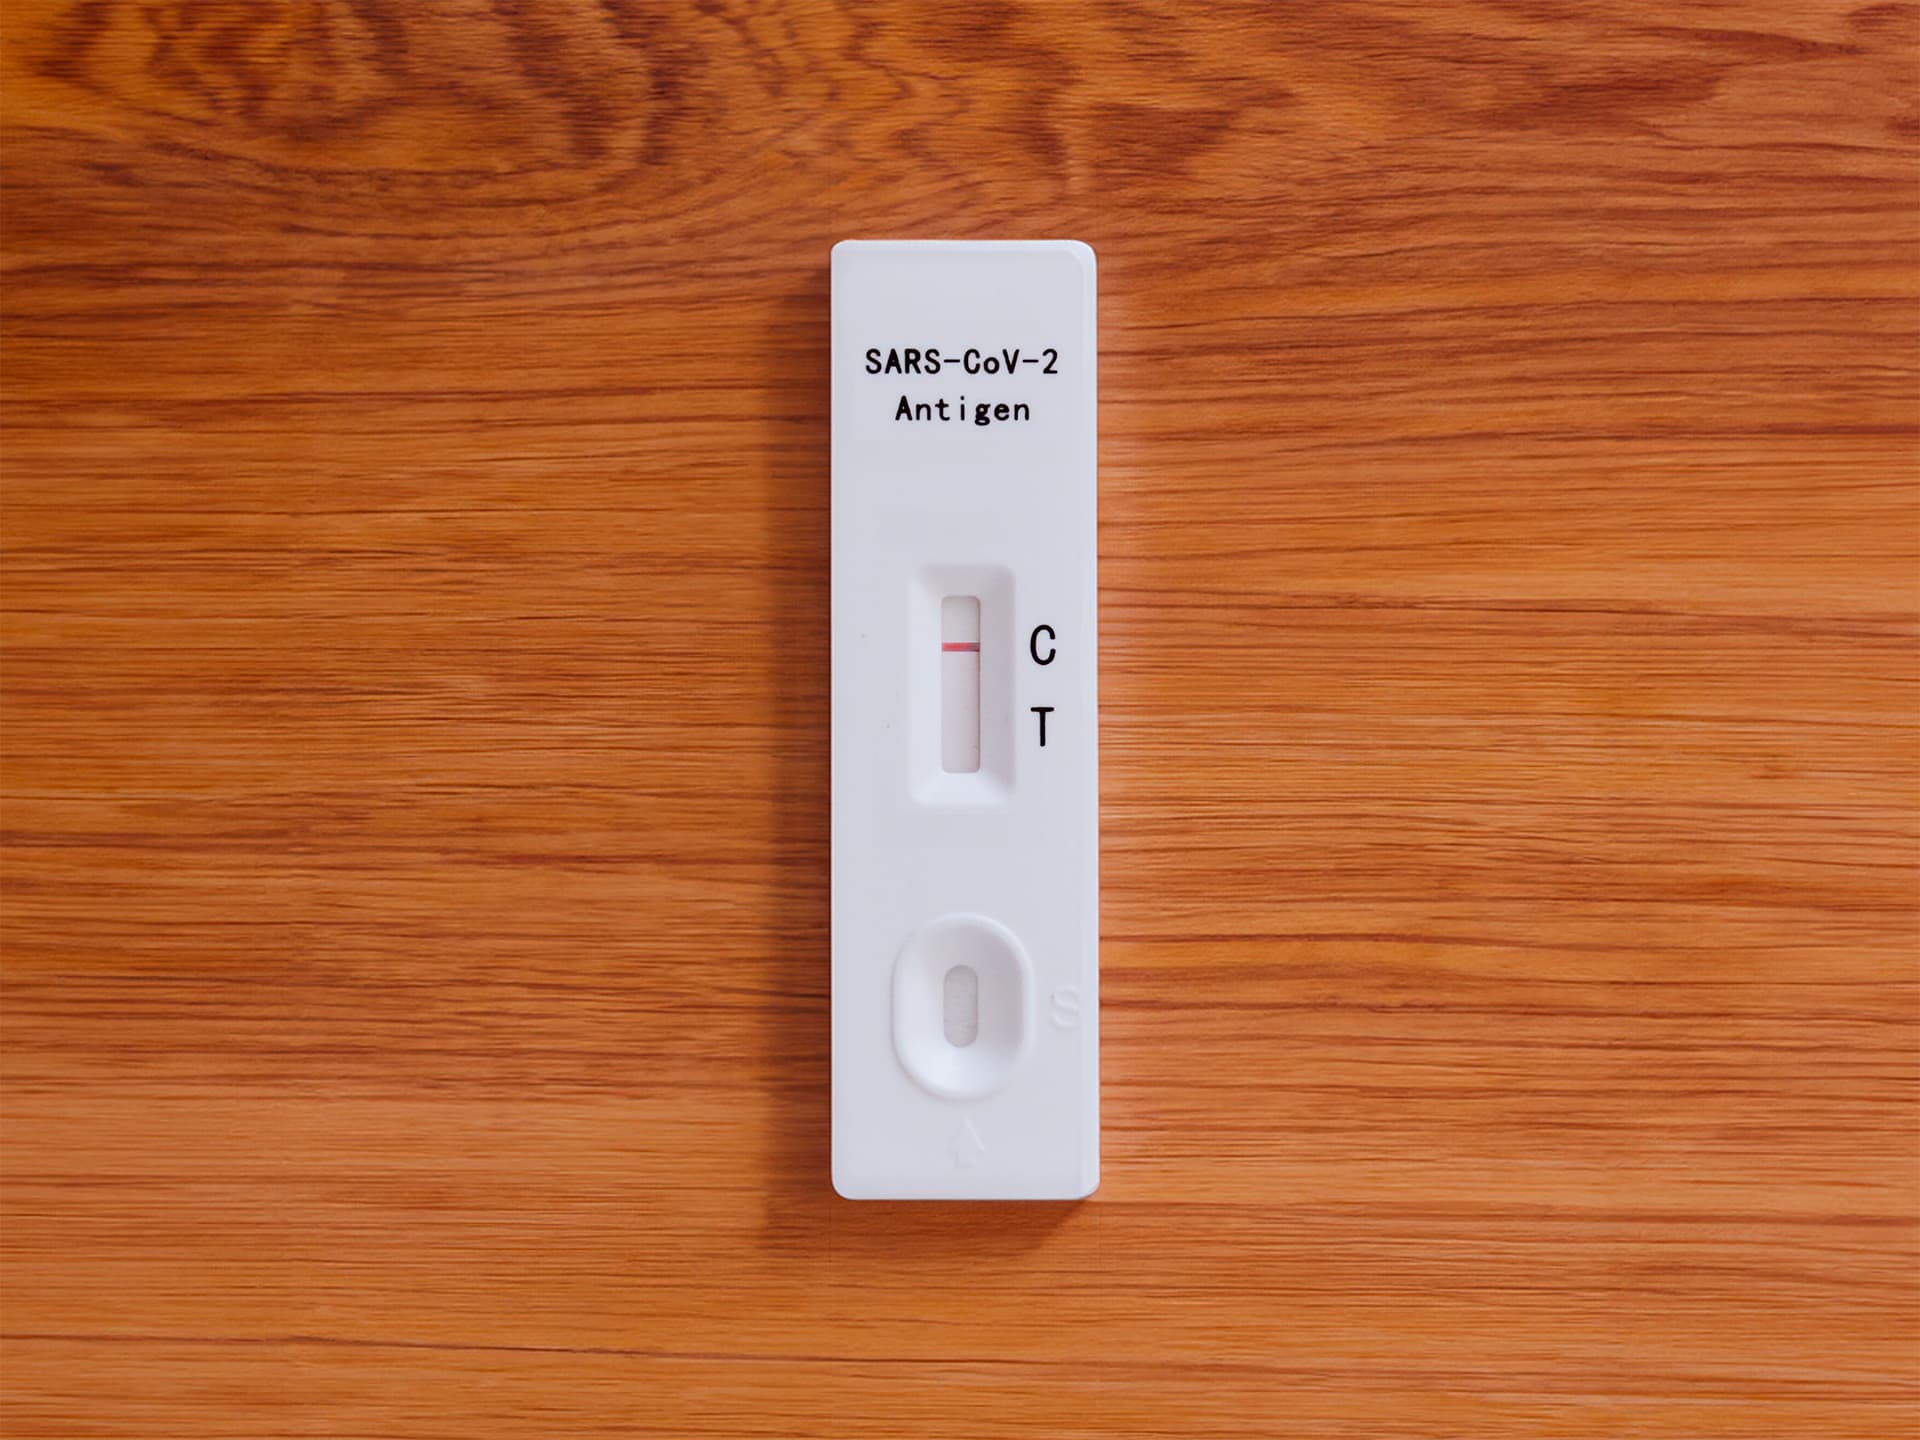
Once the analysis is complete, you not only receive the result but can also view image details in a convenient chart or pixel view.
Our process in detail
Several steps are required to ensure the assay is interpreted correctly. We would like to briefly outline these steps for transparency.
Image preprocessing
Before analyzing the image, several preprocessing steps are performed. The image is resized to 640x640 pixels, and the rotation angle of the assay cassette or strip is determined. Please note that we can only process images with a rotation angle of up to 25 degrees.
Test + RIO detection
Pixel analysis
To interpret the lateral flow assay, the test image is first converted to greyscale without weighting. A test pixel is then selected for each y-coordinate. In the next step, potential peaks are identified based on the grey values.
You can view the result of the pixel analysis in the visualization chart.
Interpretation
In the final step, the peaks are checked for plausibility. If no peak is found, the test is considered unused. If one peak is found, the test is assumed to be negative, or invalid if the line's position suggests so. If two peaks are found, the test is considered positive.
In this case, the ratio of the two peaks is calculated and output as the test intensity.
Do you have any questions?
If you have any questions about our approach or need further details, please refer to our FAQ section or contact us directly.
FAQs
Support us
If you appreciate our work, please consider supporting us by sharing your experience with your network or starting a partnership with our service. This will help us continue our work and further improve Quantifyr.
For more information on how you can support us, please contact us personally.